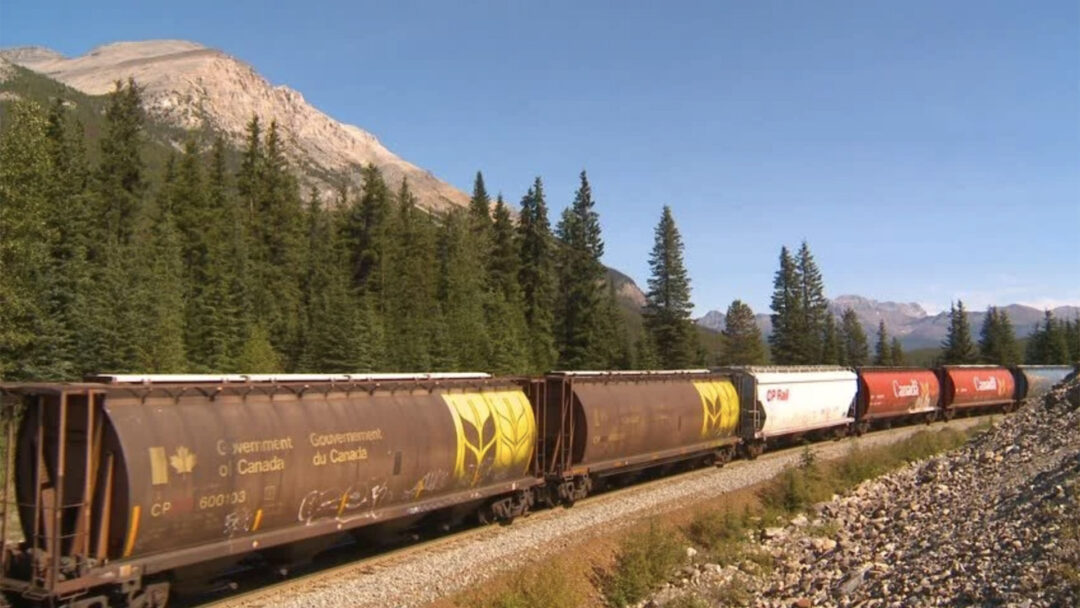
A chicken raised for meat is called a broiler. Raising one efficiently is, among other things, an optimization problem. Our client consumed approximately 440 railroad cars of feed ingredients every day and spent well over $1 billion annually on feed, so fractions of a percent mattered.
Ingredients Arrive Before the Formula
Corn supplies much of the energy. Soybean meal supplies protein and amino acids. Fats raise energy density; limestone supplies calcium; and concentrated L-lysine and DL-methionine supplements can correct a specific amino-acid shortage without adding large amounts of excess protein. Wheat middlings may be economical within practical inclusion limits. DDGS means distillers dried grains with solubles: the nutrient-rich residue left after the starch in corn has been fermented to make ethanol, combined with condensed solubles, and dried for use as feed.
Every lot is different. Corn from different farms reflects different soils, hybrids, weather, drying, and storage. Even within one harvest season, weekly receipts evolve in moisture, energy, protein, and amino-acid content. Soybean meal and byproducts also vary with their raw materials and processing. To make that point visible, the example treats corn from Farms A, B, and C, plus soybean meal from Farms D, E, and F, as separate purchasable ingredients with slightly different analyses and prices. A least-cost system must formulate against the analyzed lot, not the ingredient name alone.
| Ingredient | Energy kcal/kg | Protein % | Fat % | Fiber % | Calcium % | Dig. lysine % | Dig. methionine % | Cost/ton |
|---|---|---|---|---|---|---|---|---|
| Yellow corn (Farm A) | 3,380 | 8.2 | 3.9 | 2.1 | 0.03 | 0.25 | 0.17 | $205 |
| Yellow corn (Farm B) | 3,300 | 8.0 | 3.7 | 2.3 | 0.03 | 0.24 | 0.16 | $220 |
| Yellow corn (Farm C) | 3,250 | 7.8 | 3.6 | 2.5 | 0.03 | 0.23 | 0.15 | $230 |
| Soybean meal (Farm D) | 2,470 | 48.0 | 1.5 | 3.5 | 0.30 | 3.05 | 0.69 | $395 |
| Soybean meal (Farm E) | 2,440 | 47.0 | 1.5 | 3.6 | 0.28 | 2.92 | 0.66 | $420 |
| Soybean meal (Farm F) | 2,420 | 46.0 | 1.6 | 3.8 | 0.27 | 2.80 | 0.63 | $410 |
| Wheat middlings | 1,800 | 17.5 | 4.5 | 8.5 | 0.13 | 0.65 | 0.28 | $180 |
| DDGS | 2,800 | 27.0 | 10.0 | 12.0 | 0.26 | 0.75 | 0.55 | $290 |
| Poultry fat | 8,000 | 0.0 | 99.0 | 0.0 | 0.00 | 0.00 | 0.00 | $850 |
| Limestone | 0 | 0.0 | 0.0 | 0.0 | 38.0 | 0.00 | 0.00 | $65 |
| L-Lysine Supplement | 0 | 0.0 | 0.0 | 0.0 | 0.00 | 78.0 | 0.00 | $2,000 |
| DL-Methionine Supplement | 0 | 0.0 | 0.0 | 0.0 | 0.00 | 0.00 | 99.0 | $3,000 |
The industry convention is mixed rather than all-percentage. Metabolizable energy is typically expressed as kcal/kg or MJ/kg. Crude protein, fat, fiber, calcium, lysine, and methionine are commonly shown as percentages of the complete diet or ingredient; amino-acid tables should specify whether values are total or digestible. Trace minerals and vitamins use units such as mg/kg, µg/kg, or IU/kg.
Multiply every decision below by 440 railcars arriving daily, and the stakes of the mathematics become obvious.
The Target Nutrition
Young broilers require a denser formula than birds near market weight. The simplified targets below use Ross guidance; an animal nutritionist would also specify available phosphorus, sodium, chloride, additional digestible amino acids, vitamins, trace minerals, pellet quality, and practical ingredient limits.
| Phase | Age | Energy kcal/kg | Crude protein % | Calcium % | Dig. lysine % | Dig. methionine % |
|---|---|---|---|---|---|---|
| Juvenile / starter | 0-10 days | 2,975 | 23.0 | 0.95 | 1.32 | 0.55 |
| Adult / late finisher | 40-51 days | 3,125 | 18.0 | 0.60 | 1.02 | 0.45 |
Ross notes that crude-protein figures are guidance rather than a biological minimum in isolation; the essential objective is an adequate amino-acid profile. In a commercial model, formulators commonly discourage unnecessary protein excess because it can waste expensive ingredients and add metabolic and environmental burdens.
A Real Least-Cost Example
For this example, I constructed and solved an actual linear program. The decision variables are ingredient shares. The objective minimizes cost per ton. Constraints require the shares to sum to 100%, meet adult-finisher minimums for energy, protein, calcium, digestible lysine, and digestible methionine, keep fiber below 5%, and hold protein between 18.0% and 18.5%. I removed the earlier artificial farm-lot caps so the model is free to choose the most economical corn and soybean-meal sources.
Adding the L-lysine and DL-methionine supplements lets the optimizer correct amino-acid shortages directly instead of buying enough soybean meal to oversupply crude protein. Once the artificial supply caps are removed, the result behaves as intuition suggests: Corn A dominates Corn B and C at these assumed prices and analyses, while soybean meal D dominates E and F. The unused lots remain visible in the table with zero shares, so the reader can see that the optimizer considered and rejected them. The resulting blend hits the binding targets closely.
| Ingredient | Share | Cost contribution |
|---|---|---|
| Yellow corn (Farm A) | 72.795% | $149.23 |
| Yellow corn (Farm B) | 0.000% | $0.00 |
| Yellow corn (Farm C) | 0.000% | $0.00 |
| Soybean meal (Farm D) | 25.064% | $99.00 |
| Soybean meal (Farm E) | 0.000% | $0.00 |
| Soybean meal (Farm F) | 0.000% | $0.00 |
| Wheat middlings | 0.000% | $0.00 |
| DDGS | 0.000% | $0.00 |
| Poultry fat | 0.568% | $4.83 |
| Limestone | 1.324% | $0.86 |
| L-Lysine Supplement | 0.094% | $1.89 |
| DL-Methionine Supplement | 0.155% | $4.65 |
| TOTAL | 100.000% | $260.45 / ton |
Resulting profile: Energy 3,125 kcal/kg; protein 18.000%; fiber 2.406%; calcium 0.600%; digestible lysine 1.020%; digestible methionine 0.450%.
This remains an educational model with illustrative analyses and prices; a qualified poultry nutritionist would add the omitted constraints before feeding it. The workbook behind these tables, exposing every coefficient, formula, constraint, contribution, and cost, is available on request.
The Larger Engagement
Traditional least-cost formulation asks what to blend from ingredients available now. Our client's real problem also included procurement: what to buy, from whom, in what quantity, and when, knowing that future prices and lot characteristics would change? The cheapest railcar could become expensive after formulation if it required additional energy or amino-acid supplementation.
We modeled procurement, lot quality, inventory, expected prices, and future formulas together. At 440 railcars per day, a one-percent improvement against a billion-dollar ingredient bill represented roughly $10 million per year. Independent experts said the solution, applied industry-wide, would be worth $1–2 billion per year in savings.

See other Agribusiness: Sugar · Enzymes · Orange Juice · Milk